

Introduction
Asthma is a chronic inflammatory condition of the airways that poses a significant global public health concern, especially in childhood. It is estimated to affect approximately 262 million individuals worldwide and results in 461,000 deaths annually.1 In Latin America, childhood asthma has a prevalence of 17.3% at 6-7 years of age and 15.8% at 13-14 years of age.2 In Colombia, confirmed asthma has a prevalence of 9%, while unconfirmed cases stand at 69.9%, indicating a potential underdiagnosis within the population. These findings establish asthma as the country’s second most prevalent chronic respiratory condition.3 Furthermore, the city of Cali in Colombia has reported an elevated risk of mortality attributable to respiratory diseases.4
A hallmark of asthma is airway narrowing, which can challenge an individual’s ventilatory mechanics. Bronchial obstruction can result in increased breathing work, changes in lung volumes, imbalances in ventilation/perfusion (V/Q) ratios, and impaired gas exchange.5,6 In addition, these conditions can affect thoracic mobility, which refers to the ability of the thoracic cage to expand during inhalation and exhalation.5,7,8
In contemporary clinical practice, cardiopulmonary physiotherapists emphasize the importance of conducting comprehensive assessments to determine suitable intervention strategies for various respiratory pathologies.9–11 In recent years, cirtometry has emerged as a vital and reliable method for evaluating thoracic mobility.12 This assessment technique is characterized by its simplicity, cost-effectiveness, and consistent reliability across different examiners, within the same examiner, and when repeated.13 It involves the application of a non-distensible tape around the thorax at the axillary (CAx) and xiphoid (CX) levels to obtain non-invasive measurements.14
Given the limited research on thoracic mobility in asthmatic children, this study aimed to describe the thoracic mobility of 6- to 11-year-old children diagnosed with asthma and compare it with that of non-asthmatic children in schools in Cali, Colombia.
Materials and methods
In June 2023, a cross-sectional analytical study was conducted with healthy children and children diagnosed with asthma from two schools in Cali, Colombia. These schools were selected because they are located in socio-demographically representative areas of the city. The parents or guardians of the children were contacted to explain the study’s objectives and request consent for their children’s participation. The study followed the recommendations of the Declaration of Helsinki (2013)15 and was approved by the Ethics Committee of the Institución Universitaria Escuela Nacional del Deporte (Act Number 40.07.101/May 29, 2023). In addition, the confidentiality of the participants was guaranteed through an informed consent procedure in accordance with the Colombian Law on the Protection of Personal Data (Law 1581 of 2012).16 The study included children aged 6 to 11 who attended schools in 2023 and whose parents or guardians voluntarily signed the informed consent form. Participants with respiratory, cardiac, rheumatic, musculoskeletal, and orthopedic diseases and children without signed consent forms were excluded from the study. Non-probability convenience sampling was used to allow voluntary participation in the study.
Measuring instruments and procedures
The study used the self-administered International Study of Asthma and Allergies in Childhood (ISAAC)17 questionnaire to examine sociodemographic variables, prevalence, and risk factors for asthma. This questionnaire was developed in a multi-center study and has been rigorously validated in medical institutions around the world. It encompasses a range of open and closed questions on sociodemographic characteristics such as sex, age, socioeconomic status, and aspects related to wheezing, rhinitis, eczema, treatment modalities, and the child’s medical history.17 Notably, the Spanish version of the questionnaire has demonstrated high specificity (91.6%) and sensitivity (64.7%) in identifying asthma in the general population.18 The questionnaires were distributed online, with parents completing them using the Google Forms® platform.
A non-distensible tape measure (Lufkin W606PM) was used for cirtometry according to the established protocol of Bockenhauer et al.14 Mobility assessment included measurements at two specific levels: CAx at the level of the third intercostal space and the fifth thoracic spinous process, and CX at the level of the xiphoid and the tenth thoracic spinous process. The anatomical reference points of each level were marked with an indelible ink marker by a single examiner with expertise in this area to ensure accurate placement of the tape measure. Measurements were taken with the subject standing, arms relaxed at the sides, and chest uncovered (or with a strapless top for female subjects).
The tape measure was placed comfortably over the marked reference points to ensure the subject’s comfort throughout the process. The subject was then instructed to inhale deeply through the nose and exhale through the mouth, with verbal commands from the examiner to encourage maximal inhalation and exhalation. The maximum diameter of the chest during inhalation and exhalation was measured in centimetres, and the difference between the two movements was calculated. The examiner remained vigilant to prevent compensatory gestures. Three attempts were made ten seconds apart, and the highest measurement was selected.
Anthropometric weight, height, and BMI measurements were obtained to assess potential confounding factors. Weight was assessed using a calibrated scale while the participant maintained an upright posture with arms resting naturally. Height was measured using a SECA 206 wall-mounted measuring rod, with the participant standing against the wall and performing a sustained inhalation for an accurate centimetre measurement. BMI was calculated by dividing weight by the square of height (weight/height2). Participants were then categorized as obese, at risk for obesity, average weight, or underweight based on age-specific percentiles using WHO criteria.
Analysis of results
Data were analyzed using STATA 14® statistical software. Participants with more than 20% data loss from the ISAAC questionnaire were excluded from the analysis. Descriptive statistics were used to present quantitative variables, reporting mean and standard deviation, and qualitative variables, reporting frequency and percentage. The normality of data was assessed using the Kolmogorov-Smirnov test. Group differences were assessed using the Student’s t-test and Wilcoxon-Mann-Whitney test, which were selected based on variable characteristics. Statistical significance was set at p < 0.05. Analysis of covariance was not required because no baseline differences in confounding variables were observed between groups.
Results
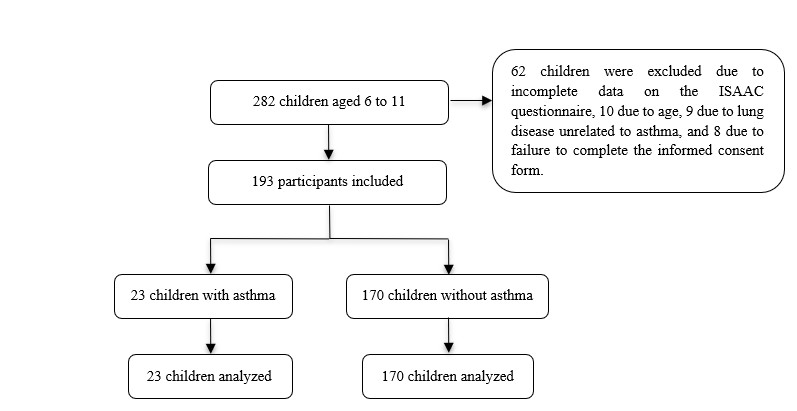
Of the 282 children initially recruited, 62 were excluded because of incomplete data on the ISAAC questionnaire, 10 because of age, 9 because of lung disease other than asthma, and 8 who did not provide informed consent. Finally, 193 children who met the inclusion criteria were included (Figure 1). Among them, 11.9% received a diagnosis of asthma.

The sex distribution was 52.9% male, with the majority in the second (26.9%), third (24.9%), and fifth (25.4%) grades of primary school. Regarding age, 50.3% were between 6 and 8 years old, and 49.7% were between 9 and 11. The majority identified themselves as of mestizo ethnicity (54.9%) and came from lower socioeconomic strata: 1 (55.4%) and 2 (34.7%). In addition, 92.8% reported belonging to the Colombian health system (Table 1).
A statistically significant difference was found in the prevalence of maternal asthma history when comparing children with and without asthma (47.8% for children with asthma vs. 19.4% for the healthy group, p = 0.000). No other statistically significant differences in sociodemographic characteristics were found.
Regarding anthropometric characteristics, the mean height was 1.34 m ± 0.1, the mean weight was 33.9 kg ± 10, and the BMI was at the upper limit of underweight with a mean of 18.4 ± 3.3. No statistically significant differences were found in the variables of height (p = 0.394), weight (p = 0.311), and BMI (p = 0.210) when comparing the groups of children with and without asthma (Table 2).
The data indicate a significantly higher prevalence of asthma symptoms in the asthmatic group compared to the non-asthmatic group during the past year. Specifically, the asthmatic group showed significantly higher rates of wheezing (73.9% vs. 11.2%, p = 0.000), wheezing or whistling before or after exercise (30.4% vs. 2.9%, p = 0.000), chest congestion with secretions in the absence of a cold (30.4% vs. 8.2%, p = 0. 001), rhinitis or nasal allergy (43.5% vs. 24.7%, p = 0.026), hospital admissions for wheeze or asthma (21.7% vs. 2.9%, p = 0.000), and full days of absence from school due to wheeze or asthma (43.5% vs. 2.4%, p = 0.000) compared to the non-asthmatic group (Table 3).
The asthmatic group had a higher prevalence of wheeze triggers compared to the non-asthmatic group for exposure to weather changes (17.4% vs. 5.3%, p = 0.053), fumes (30.4% vs. 2.9%, p = 0.000), dust (47.8% vs. 3.5%, p = 0.000), colds (47.8% vs. 9.4%, p = 0.000), and tobacco smoke (13% vs. 1.8%, p = 0.023) (Table 4).
In assessing thoracic mobility using cirtometry, the asthmatic group exhibited lower values in the CAx measurement, with a mean of 5.18 cm ±1.2, compared to the non-asthmatic group, which demonstrated a mean of 5.82 cm ±2. This disparity showed statistical significance (p = 0.047). Similarly, the CX measurement for the asthmatic group displayed reduced values, with a mean of 4.78 cm ±1.3, in contrast to the non-asthmatic group, with a mean of 5.35 cm ±2. However, this variance did not attain statistical significance (p = 0.096) (Figure 2).
