
Introduction
The Centers for Disease Control and Prevention (CDC)1 and the British Lung Foundation2 define pneumonia as an acute lung infection caused by viruses, bacteria, and fungi resulting in accumulation of fluid and pus at the level of the alveoli, causing difficulty in oxygenation. According to a report by the World Health Organization,3 it is a leading cause of mortality and morbidity around the world.
In clinical settings, the diagnosis of pneumonia relies on clinical presentation, primary pathology, and laboratory results and often includes chest radiography.4 This radiographic assessment plays a pivotal role in evaluating the severity of pneumonia. In contrast, it has some limitations, such as the fact that many physiological structures may mask pathologic manifestations like consolidations, granulomas, cysts, and adenopathy.5 Interpretation may vary based on the interpreter’s knowledge and experience of patient positioning, time to process, cost of the x-ray and radiation exposure may also limit its usefulness.6
Significant health and financial burdens can be incurred as a result of pneumonia.7 Despite significant developments in treatment approaches, the clinical burden of ventilator-associated pneumonia (VAP), community-acquired pneumonia (CAP), and hospital-acquired pneumonia (HAP) is increasing. Early discovery of the disease and timely treatment can minimize mortality. Blood cultures, sputum cultures, bronchoscopy, pulse oximetry, and CXRs can be used to identify pneumonia. To interpret X-ray images precisely, an experienced radiologist is required; however, two-thirds of the world lacks adequate radiological services.8 Due to the lack of resources and hospital facilities in low-income countries, diagnosis becomes more difficult when there are fewer trained healthcare personnel or old technology is available. X-rays are traditionally used to diagnose disease, but they are limited or can lead to misdiagnosis and an increase in the patient’s financial burden.9 Using X-rays is always challenging since technical training is necessary first.10 Furthermore, an extensive study is required to analyze the medical images, which makes it difficult for radiologists to interpret and diagnose based on CXRs alone. Studies have found that this can have a substantial impact on patients’ treatment, morbidity, and mortality in low-income countries.10,11
Advances in diagnostic radiology provide a less invasive, non-radiating, simple tool to improve the diagnosis of pneumonia through point-of-care LUS.12,13 The use of point-of-care LUS now extends far beyond intensive care and can be beneficial in cardiac emergencies and interventional laboratories.14,15
The most common findings for diagnosing early pneumonia via LUS are scattered or irregular margins at the subsequent area with loss of A-lines known as the shred sign or by liver-shaped echogenicity resulting from fluid-filled alveoli, or tissue-like appearance of an area seen more frequently on B mode may indicate pneumonia.16,17
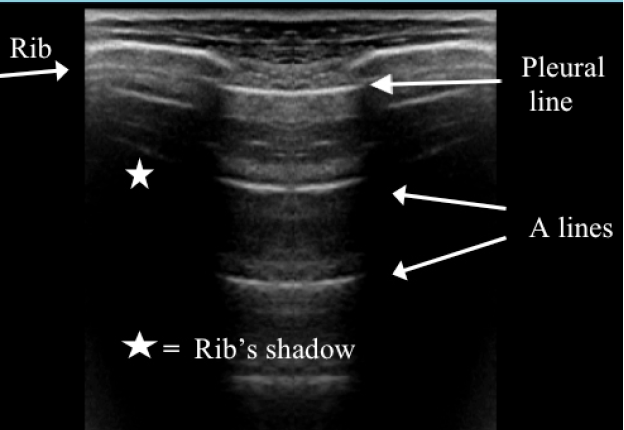
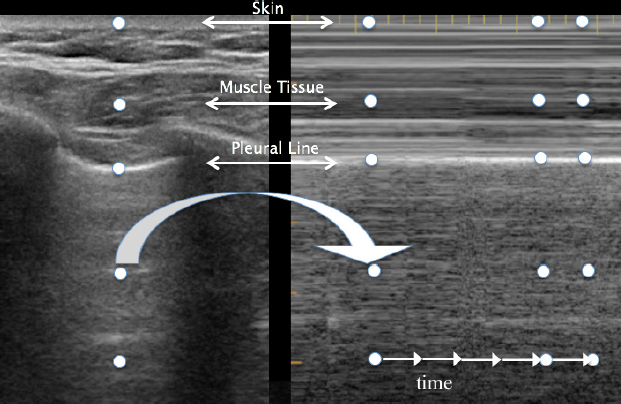
LUS consists of two basic modes: brightness B-mode and M-mode. B-mode, or monochrome or two-dimensional mode, is the most fundamental mode and refers to the conventional black-and-white image displayed on the ultrasound display (Figure 1). The motion mode or M-mode is used to visualize movement activities or analyze an object’s motion (Figure 2). The vertical axis represents movement in a single-dimensional plane, while the horizontal axis represents time. Lung and pleural structures and pathologies such as pneumothorax and pleural effusion are easily identified in this mode.18

The A-line is a manifestation of air in a healthy lung. They are horizontal, regularly spaced hyper-echoic lines representing reverberations of the pleural line.19

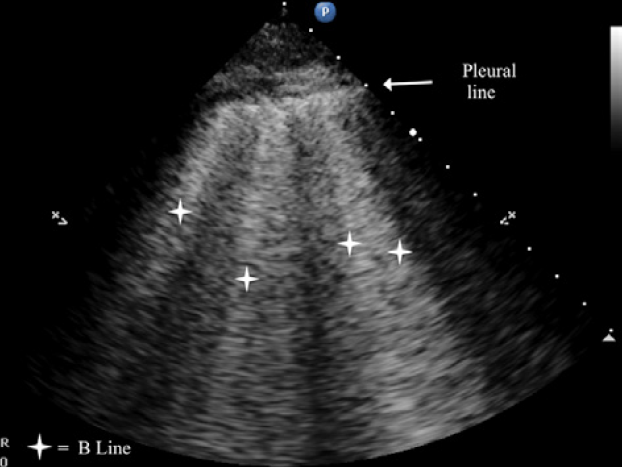
B-lines are small, well-defined comet tail-like artifacts arising perpendicularly from the pleural line (Figure 2a). During respiration, these lines move along the pleural line and may erase A-lines. One or two B-lines may be seen per intercostal space in 30% of healthy individuals, particularly in dependent regions of the lung20 B-lines indicate filling of the interstitial space and are often observed in pulmonary edema.21

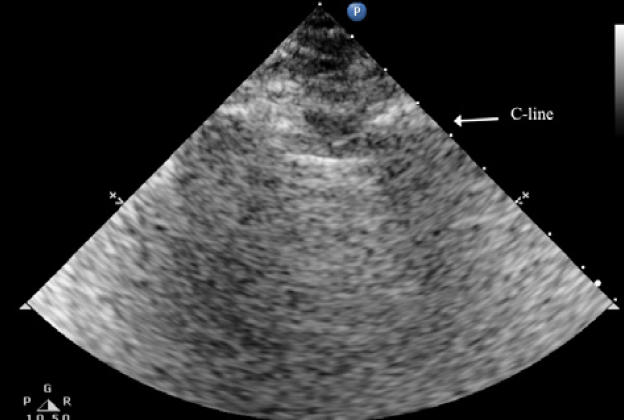
The C lines are defined as hypoechoic sub-pleural focal images produced by condensed lung tissue without the presence of the visceral pleural line gap. They are typically conical or dome-shaped, thus the name cupola (Figure 2b). C lines are not true lines but are designated as such in order to maintain consistency.22

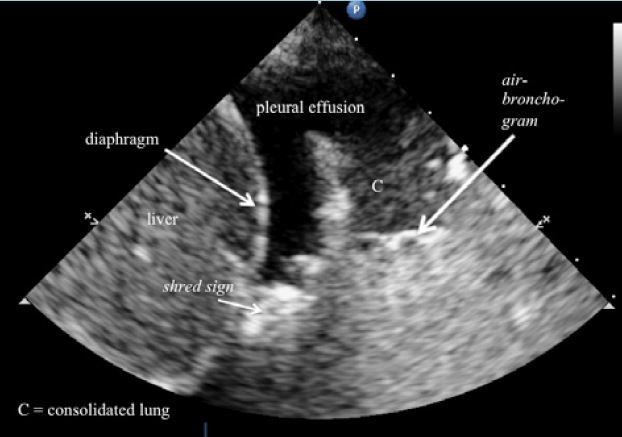
Typical patterns of ultrasound imaging are seen at various scanning points during the diagnosis of pneumonia. From the anterior perspective, typical C-lines identified by a curvilinear aspect of the pleural line are caused by adjacent consolidated tissue; as in pneumonia, the alveoli are filled with fluid (Figure 3). The non-aerated lung tissue is thus readily transverse by ultrasound beams, producing an image comparable with liver tissue.7,18

Nearly all consolidations touch the pleural line. As a result of gravity, consolidation usually appears first at the posterior-lateral point. By looking for air Bronchogram or the shred sign, pneumonia can be further analyzed. This is caused by the reflection of ultrasound beams in air-filled bronchi surrounded by consolidated tissue. The shred sign appears when the border between aerated and consolidated lung is not clearly defined.23
Methods
Point-of-care LUS may improve patient care in terms of availability, accuracy, and reliability24,25 This systematic review aims to define the benefits of point-of-care LUS over CXR when diagnosing pneumonia among pediatric, adult & geriatric patient populations.
Original research, systematic reviews, and meta-analyses published between 2017 and 2021 comparing X-rays to point-of-care LUS for diagnosing pneumonia were included in this review.
The decision to limit the scope of this study from 2017 to 2021 is due to capturing the most recent data that compares these two modalities in diagnosing pneumonia. This timeframe aligns with the rapid progression of imaging techniques and diagnostic protocols within the specified period. However, considering the ongoing advancements in medical technology and the use of LUS, extending the review beyond this timeframe could provide a more comprehensive perspective on the trends and further enrich the analysis. Additionally, only English-language articles were included. Case reports and the studies performed on COVID-19 and its variants to detect pneumonia were excluded from the study.
The search was performed utilizing PubMed, Google Scholar and Cochrane Library using the flowing search string: “Lung ultrasound” or point of care “lung ultrasound” versus “chest x-ray” and “pneumonia,” “Accuracy” and “Specificity” or “sensitivity” and training or" knowledge" in “ICU” or “Emergency”.
Two independent investigators conducted the article selection process. The inter-rater agreement was assessed using the kappa coefficient, a measure of agreement that considers the possibility of chance agreement. The Kappa coefficient for the two investigators was 1.00, indicating an almost perfect level of agreement. This high level of agreement suggests that the article selection process is reliable and that the selected articles are likely to be of high quality.
The quality of the selected studies was reviewed according to the quality assessment tool (QUADAS-2). The tool consists of 4 key elements, including patient selection, reference standard, index test, and flow and timing. Each domain is judged on two main components (a) risk of bias and (b) concern to judge applicability. Both these domains are rated on a scale of high, unclear, and low. The QUADAS-2 tool evaluation is presented in the supplementary information (Appendix A).
Stata Version 16 was utilized in the analysis process. The estimated pooled sensitivity and specificity are obtained using a bivariate model of the selected data. The bivariate model analyzes the specificity and sensitivity of the study through a random effect. All the results were presented with a CI of 95%. Furthermore, RevMan 5.4.1 is utilized to determine the sensitivity, specificity, positive predictive value (PPV), and negative predictive value (NPV) of both LUS and CXR. Furthermore, the odds and risk ratio were also calculated.
Results
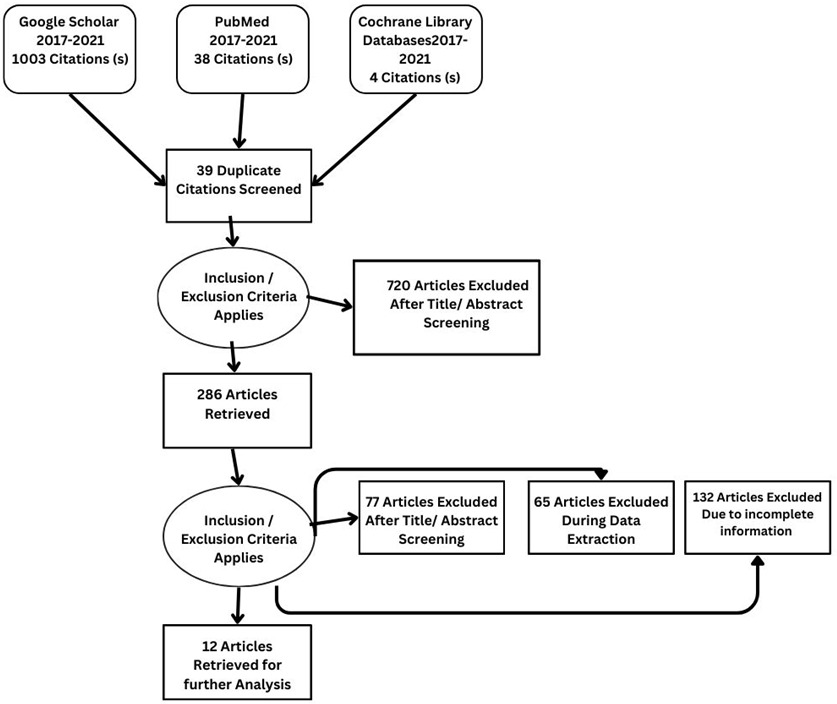
Details regarding the study selection are presented in Figure 4. The search yielded 1045 articles. We included 12 studies involving 2897 patients who underwent qualitative assessment.
Summary of the study design
From Google Scholar, PubMed, and Cochrane, 1045 articles were identified. After reviewing the title and abstract, 286 studies were selected for review of the literature, methodology, and result sections. Applying inclusion and exclusion criteria, 77 articles were excluded after full-text screening. During the data extraction process, a further 65 articles were excluded, while an additional 132 articles were excluded due to incomplete information. Twelve studies, comprising a sample size of 2897, met the criteria for qualitative analysis.
Study characteristics
The main characteristics of the retrieved study are shown in Table 1. Table 1 shows that the sample size selected from the 12 retrieved studies ranged between 28-1637, and all studies were published between 2017 and 2021. Among all the studies, only one study26 enrolled neonatal patients, while 3 included the pediatric population.13,27,28 In terms of study design, all the selective studies were prospective and observational in nature. Furthermore, nine studies utilized the blinding method13,25,27–33 (see Table 2).
Demographic details of studies
Table 3 provides a clear snapshot of essential findings from 12 important studies that directly compare the effectiveness of LUS and CXR in diagnosing pneumonia. Table 3 summarizes key details as to how often each method correctly identifies pneumonia (PPV and NPV), their ability to adjust the likelihood of pneumonia (Positive and Negative Likelihood Ratios), and the prevalence of pneumonia within the studied groups.
Diagnostic accuracy of LUS and CXR
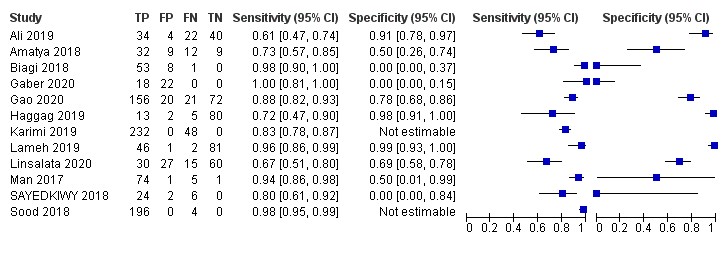
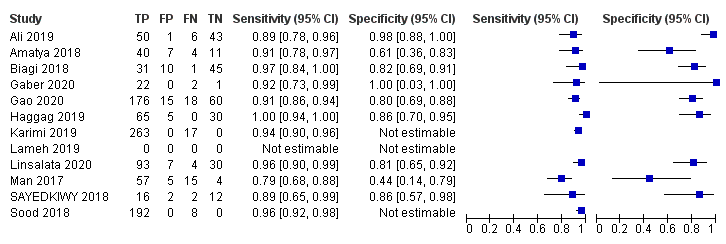
Drawing insights from 12 selected studies, the confluence of data reveals a consolidated sensitivity of 92.13% (95% CI: 84.07 to 96.29) for LUS. Concurrently, the pooled specificity emerges at 81.91% (95% CI: 72.71 to 88.50), accompanied by a Diagnostic Odds Ratio of 53.05%. The positive and negative likelihood ratios stand at 5.09 and 0.096, respectively. With the same set of 12 studies, CXR unfurls a pooled sensitivity of 64% (95% CI: 31.11 to 95.46). Notably, CXR exhibits higher specificity at 94.3%.95% CI: 79.09 to 98.65), while the Diagnostic Odds Ratio is 29.76%. The positive and negative likelihood ratios stand at 11.34 and 0.380, offering significant insights, respectively.


Odds Ratio
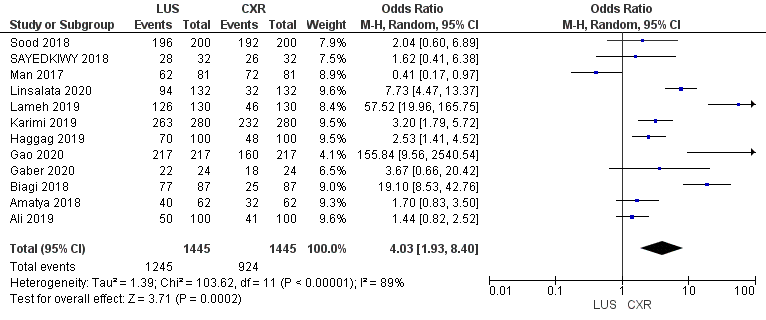
Figure 7 illustrates the Odds Ratio under the Random Model, with a Chi-squared value of 103.62 (p < 0.00001), demonstrating significant deviation from expected values. A substantial I2 value of 89% suggests notable study heterogeneity. The Z-score of 3.71 further reinforces the statistical significance, affirming the meaningfulness of the Odds Ratio assessment within our study’s context.

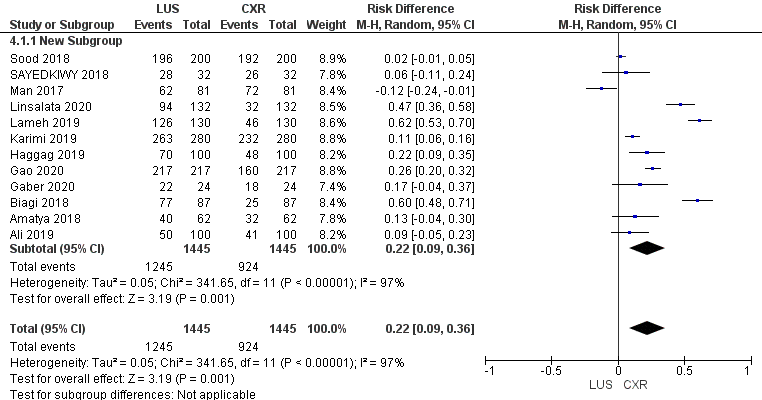
Risk Difference
Risk difference is graphically presented under a Random Model. The statistical analysis reveals a significant Chi-squared value of 341.65 (p < 0.00001), indicating a substantial departure from expected values. The high I2 value of 97% suggests notable heterogeneity across the included studies. The Z-score of 3.19 further supports the statistical significance, reinforcing the importance of the observed risk difference within the framework of our study.
The comprehensive analysis of 12 studies illuminates the pooled sensitivity of LUS, at 92.13%, demonstrating its ability to accurately identify positive cases across diverse populations. In parallel, CXR displays a sensitivity of 64%. LUS reveals a pooled specificity of 81.91%, effectively categorizing negative cases, while CXR showcases a notably higher specificity of 94.3%. Moreover, the Diagnostic Odds Ratio underlines LUS’s diagnostic capacity with a value of 53.05%, compared to CXR’s, i.e., 29.76%. Positive and negative likelihood ratios provide further insights into its efficacy. Statistical significance, confirmed by Chi-squared tests and P-values, supports these findings. The substantial heterogeneity across studies accentuates the nuanced nature of pneumonia diagnosis methods. This comprehensive analysis provides healthcare practitioners with valuable insights to inform their diagnostic decisions and enhanced patient care strategies.

Discussion
We conducted a systematic review to assess LUS’s sensitivity, specificity, and accuracy as a diagnostic tool. Also, we assessed the benefits of point-of-care LUS over CXR when diagnosing pneumonia in pediatric, adult and geriatric patients compared with other systematic reviews addressing these modalities.24,34–36
CXR Vs LUS in geriatric population for detecting pneumonia
LUS was found to be more specific and sensitive for diagnosing pneumonia in geriatric patients. The study utilized LUS on the second day of admission for the patients who developed ventilator-associated pneumonia.23,37
The sensitivity of LUS was 91.67 %, whereas the sensitivity of CXR was 75.83%, and the specificity was 71%. A meta-analysis included ten studies in which LUS and CXR were compared. Six of the studies included geriatric patients admitted to the emergency department for pneumonia, while four of the studies included critically ill patients. Using ultrasound as the diagnostic modality, it was found that the pooled sensitivity of using ultrasound was 94%, and the specificity was 96% for the detection of pneumonia.34
In another study, LUS also exhibited higher diagnostic accuracy, with a sensitivity of 91%, compared to the lower sensitivity of CXR at 67%. A CXR often misrepresents pneumonia and doesn’t identify it, exposing patients to ionizing radiation.32 Elderly patients were included in this study, of which 94 were diagnosed with acute pneumonia using LUS. In patients with pneumonia, LUS is the better modality based on the expert technical knowledge and competency of the person who performs it.25
Another study in the geriatric population also showed that LUS plays a significant role in the detection of pneumonia. This study found that false-positive cases were 6.2% and false-negative cases were 6.2%, while the sensitivity and specificity for LUS were both 87.5% and 89.3%, respectively. It is recommended that emergency care practitioners and intensive care specialists master this skill for better and more accurate diagnosis.38 The use of pulmonary sonography can assist in the diagnosis of the disease, and this tool is 83% specific and 85% sensitive. Contrary to other modalities such as CXRs, which can increase the cost of a hospital stay and also have a lower probability of correctly diagnosing a disease.33
CXR vs. LUS in pediatric for detecting pneumonia
LUS is becoming increasingly popular for diagnosing pneumonia among children. A study found that 72 out of 81 patients had pneumonia, which was diagnosed using radiography but later correctly identified using LUS. This study showed 72% sensitivity in detecting interstitial pneumonia. LUS is more accurate than CXR for identifying community-acquired pneumonia.27
Another study concluded that CXR is not accurate in diagnosing consolidation >1 cm, but LUS is able to do so with greater certainty. As an alternative to a chest radiograph, LUS can detect pneumonia in neonates with a higher degree of accuracy.13 Based on the study, LUS combined with other parameters for diagnosing pneumonia demonstrated better outcomes than using multiple parameters without ultrasound, proving it to be a highly recommended modality for identifying ventilator-associated pneumonia in children.39
CXR vs. LUS in adults for detecting pneumonia
Chest ultrasound is the most recommended and is gaining popularity because it is cost-effective, highly accurate, and has few side effects. The study reported LUS to have a higher degree of accuracy than CXR.31
X-rays of the chest are more dangerous due to the radiation emitted to obtain the film. They are also not cost-effective, and their reliability is always in doubt. With point-of-care LUS, diagnosing the disease more accurately, at a lower cost, and in a safer manner is possible. Additionally, it is cost-effective in low-income or low-resource countries like Pakistan or other developing nations.
Additionally, CXR for diagnosing pneumonia has lower accuracy and higher cost than LUS. In addition, this can delay the detection of the disease, which further reduces the chances of recovery.30 Also discussed is the effectiveness of LUS compared with CXR. In community-acquired pneumonia, when CXRs were first used, about 48% of cases were correctly diagnosed, while LUS helped to identify the disease in 70%of patients; however, computed tomography was the gold standard, which gave a 100% accuracy rate for diagnosis. A patient who is critically ill and on a ventilator may not be able to undergo computed tomography. As a result of its high cost in resource-limited countries, it also has limited fidelity.40 In contrast, LUS is cost-effective, portable, and has higher sensitivity and specificity.
Earlier diagnosis of pneumonia may lead to a better outcome, and this early diagnosis can be accomplished with LUS. According to the study, the cases that were confirmed using computed tomography but missed using LUS accounted for almost 6.1% of confirmed cases. In contrast, the missed cases due to chest radiography accounted for 17%. In this study, LUS sensitivity was 93% and CXR sensitivity was 82%.28,32
Limitations of LUS
Despite the benefits of LUS, there are some limitations to consider, the most prominent of which is operator skill. This illustrates the importance of properly understanding and practicing LUS skills in order to obtain reproducible results.41
LUS also has patient-dependent limitations, such as difficulty examining obese patients due to the thickness of the rib cage, the presence of subcutaneous emphysema, or large thoracic dressings, all of which can alter or obstruct the transmission of sound waves to the peripheral lung.
Additionally, LUS is unable to detect hyper-inflated lung fields that result from an increase in intrathoracic pressures. Pediatric LUS does not address certain features, such as hyperinflation and the shape and size of a child’s heart, as seen on a CXR of a child suffering from respiratory distress. To be comprehensive, LUS should take 15 minutes, and if the observer is skilled enough, it can be done more quickly.42
Training and Education of LUS
LUS chiefly depends on the operator’s skills, but it is currently not clear how long training should be for respiratory care professionals to become competent at ultrasound use, despite some researchers’ attempts to standardize skills.43 However, the utility of ultrasonography is increasing, and it is suggested that, with the right education, physicians and non-physicians would be able to adapt it into their clinical practice and use it frequently.44
In terms of duration and teaching methods, LUS training programs currently available differ significantly. A number of studies have shown that LUS skills can be acquired in two to four months of training and with 20 to 80 supervised scanning sessions. To demonstrate competency in LUS, some studies have emphasized the need for a minimum of 100 chest ultrasounds; however, others have emphasized a minimum of 30 minutes to 7 months of training.45,46
Nonetheless, the literature advocated for physicians to conduct frequent LUSs to attain competence in identifying conditions such as pleural effusion, pneumonia, and pulmonary edema within a span of six weeks.47
A study by Millington et al. presented the Assessment of Competency in Thoracic Sonography, a new scale, to assess the quality of point-of-care thoracic ultrasound performed by new learners. According to Millington and his colleagues, the scale was able to make valid judgments regarding the competency in point-of-care LUS, and the majority of learning improved during the first 25-30 practice sessions.48
A Delphi consensus49 demonstrated that LUS competency assessment is LUS-Objective Structured Assessment of Technical Skills. A 26-element competency check covers six domains: indication for an LUS exam, systematic approach, technical skill, recognition and differentiation of normal anatomy from pathology, documentation and reporting, and diagnostic conclusion. According to the authors, this assessment tool provides a relevant, valid, and feasible way to assess the competency of operators from different medical specialties, including physicians and non-physicians.
To obtain LUS effectiveness in various clinical settings, such as acute care areas, operating rooms, and primary care clinics, an operator must be competent to unify six major areas of LUS (i.e., terminology, technology, technique, clinical outcomes, cost-effectiveness, and future research). Using a combination of theoretical and hands-on training, LUS can be advocated as a diagnostic tool for point-of-care clinical practice.50
Scope and Future Research
The scope of utilizing LUS for pneumonia diagnosis is extensive, offering opportunities for further exploration and advancement in clinical practice and research. As evidenced by our study, the diagnostic efficacy of LUS has been established across pediatric, adult, and geriatric populations. However, several aspects can give insight into the investigation to maximize its impact and applicability.
The development of comprehensive and standardized training programs for healthcare professionals, including respiratory care practitioners, physicians, and nurses, is essential. Focusing on skill acquisition, proper technique, and image interpretation will ensure consistent and accurate utilization of LUS for pneumonia diagnosis. Further research can explore the optimal duration, content, and methodology of these training programs to enhance proficiency and competency.
While our study highlights the benefits of LUS over CXRs, further comparative studies with other imaging modalities, such as computed tomography (CT) scans and magnetic resonance imaging (MRI), will provide a comprehensive understanding of the strengths and limitations of each modality, aiding in evidence-based decision-making and further refining diagnostic protocols.
Investigating the direct impact of early pneumonia diagnosis through LUS on patient outcomes is an area of interest. Studies assessing factors like length of hospital stay, treatment efficacy, and overall patient well-being can provide valuable insights into how LUS influences clinical management and improves patient outcomes.
Moreover, the feasibility and impact of implementing LUS in resource-limited settings and low-income countries is crucial. Research could focus on adapting training programs to establish the local healthcare workforce, assessing the cost-effectiveness of LUS, and evaluating its potential to address diagnostic challenges in regions with limited access to radiological facilities.
Investigation into specific subgroups within the pediatric population, such as neonates and infants, can also provide nuanced insights into the diagnostic accuracy and challenges of LUS. Tailoring training programs and diagnostic criteria to accommodate the unique physiological characteristics of these subgroups could enhance the utility of LUS in the pediatric population.
Further, collaborations between professional medical associations, regulatory bodies, and researchers are essential for integrating LUS into clinical practice guidelines. Future research could contribute to the development of evidence-based recommendations for incorporating LUS as a routine diagnostic tool for pneumonia across various healthcare settings.
Conclusion
In conclusion, the application of LUS for pneumonia diagnosis has demonstrated remarkable potential across different age groups. As researchers continue to investigate and refine its utilization, the scope for improving diagnostic accuracy, patient outcomes, and healthcare practices remains vast. Future research endeavors should aim to address the aforementioned areas, ultimately advancing our understanding of LUS’s role in pneumonia management and enhancing its integration into clinical care.
Acknowledgement
We extend our gratitude to Pieter Roel Tuinman (Tuinman, P.R.)18 for generously allowing us to use images from their institution’s research. Additionally, we secured permission from the Netherlands Journal of Internal Medicine editors to utilize Pieter Tuniman’s research images published in their journal.
Funding
This study did not receive any specific grant from funding agencies in the public, commercial, or not-for-profit sectors.
Competing interests
All authors have completed the ICMJE uniform disclosure form and declare no conflict of interest.
Ethical approval
Not required for this article type.