Introduction
Chronic obstructive pulmonary disease (COPD) is a progressive respiratory disorder.1,2 COPD is the fourth leading cause of death3 in Canada and is the third worldwide.4 The Public Health Agency of Canada5 reported about 4% of Canadians (approximately 780,000) aged 35 years and older were diagnosed with COPD in 2009 to 2010. In Canada, there is a substantial economic and humanistic burden from COPD.3 Individuals living with COPD experience many pulmonary and extra-pulmonary symptoms, affecting their overall quality of life and limiting their daily activities.3,6
There is increased attention on the impact of climate change on weather exposures and the effects on chronic lung diseases7 and their global health burden.8 Global climate change has increased the mean yearly ambient temperature, frequency and intensity of variable weather conditions.9 Increasing concentrations of atmospheric greenhouse gases have increased climatic temperatures, causing events of severe and prolonged heat waves, increased air pollution, and temperature variabilities.10 In Canada, the frequency and intensity of extreme weather events are predicted to increase as a result of climate variability.11
Poor air quality and extreme temperatures (both hot and cold) have been found to directly damage the lungs by inducing inflammatory responses, which may increase susceptibility to infections and risk of exacerbations.12 As a result, temperature and humidity extremes affect the lung function of individuals with COPD13 Sama et al.14 completed a cross-sectional survey examining environmental influences in individuals with COPD in Massachusetts, USA. They found that 78% of study participants were affected by hot/humid and cold/dry weather, 81% “finding it harder to breathe” in hot/humid weather, and 67% in cold/dry weather. Weather was only one of several different exposure variables they investigated; however, their impact on health outcomes was not assessed. Extremes of temperature and humidity have been associated with increases in adverse respiratory symptoms,9,15,16 reduced lung function,9,16–18 decreased health status,15,17 increased use of rescue inhalers9,16,19,20 decreased physical activity (PA),15,21,22 and increased exacerbations15,17,19,20 and hospitalizations.15,23–25 Of these studies, one conducted across Canada focused only on the effects of daily variation of weather on PA,21 and another in Northwestern, USA collected information on respiratory symptoms, exacerbations, and rescue inhaler use in cold temperatures only.9 There is a lack of evidence describing both the burden of extreme weather conditions on individuals with COPD and the impact on important health outcomes.17,25 There is also a lack of research conducted in Canada, limiting the generalizability of past results to individuals with COPD living in Canada.
The primary objective of this study was to determine what proportion of individuals with COPD were affected by extremes of weather (hot/humid and cold/dry) regarding their health status and respiratory symptoms. The secondary objective of this study was to determine the associations between extremes of weather and health status, respiratory symptoms, PA, frequency of exacerbations, rescue inhaler use, and healthcare utilization in individuals with COPD.
Materials and Methods
Study Design
A cross-sectional self-reported survey was developed to collect information on the effects of temperature and humidity on the health status, respiratory symptoms, PA, frequency of exacerbations, rescue inhaler use, and healthcare utilization in individuals with COPD in three weather conditions: moderate or “ideal” conditions (14 to 21°C and 30 to 50% relative humidity [RH]), cold/dry conditions (≤ 5°C and < 30% RH), hot/humid conditions [(≥ 25°C and > 50% RH) see Supplementary Information]. Two individuals with COPD piloted the survey and did not suggest changes to the content.
Survey Contents: Reported Health Outcomes
We have developed our survey based on previous research that has measured COPD symptoms. The COPD Assessment Test (CAT)26 assessed both symptoms and health status. Total scores ranged from 0-40, with higher scores representing worse health status. The minimum clinically important difference (MCID) of the CAT is 2 points.27 The Daily-PROactive and Clinical visit-PROactive Physical Activity (D-PPAC)28 assessed PA. Each question uses a 0 to 4-point scale; total scores normally range from 0 to 37, with a lower score indicating poorer PA (lower amount and/or higher difficulty). Because we did not measure step count and vector magnitude units, scores in this study ranged from 0 to 28. Sub-scores, D-PPAC total amount and D-PPAC difficulty were also calculated. The CAT and the D-PPAC are both valid and reliable tools that demonstrate strong internal consistency and test-retest reliability, showing the ability to measure the construct they intend to measure.26,28
Frequency of exacerbations, rescue inhaler use, healthcare utilization (doctor visits, emergency department, hospitalizations), and response actions to the weather conditions were collected. The end of the survey included items to describe our study population and identify potential confounders to weather exposure.29,30 This included demographics, daily activity and symptoms (modified Medical Research Council dyspnea scale (mMRC),31 attendance in PR and self-management program, International Physical Activity Questionnaire Short Form (IPAQ),32 respiratory medications), exacerbation history, comorbidities, prognostic indicators (e.g., smoking status, home oxygen use), and environmental variables (type of community, city size, rainfall).
Participants were asked to recall answers from the prior year (including all four seasons), not including restrictions due to the COVID-19 pandemic. The survey was completed anonymously online (SurveyMonkey® platform, San Mateo, California),33,34 by telephone or mail. Individuals received a $20 gift card for completing the survey. Ethics approval was obtained from the University (REB #: 16029).
Participants
Participants were eligible to answer the survey if they were:
-
40 years and older,35
-
Diagnosed with COPD as per GOLD criteria [2, 21] (FEV1/FVC ratio < 0.7) by a physician of any severity (mild, moderate, severe, very severe),
-
Resided in Canada for at least one year (not including times related to COVID-19),
-
Capable of providing informed consent.
Due to a poor response rate, we did not exclude individuals if they reported diagnoses of other chronic respiratory diseases or disorders, including asthma, sleep apnea, interstitial lung disease, or lung cancer. We recruited individuals from 267 pulmonary rehabilitation (PR) programs across Canada, advocacy groups, and professional respiratory organizations. We provided study posters to them and waited for individuals to contact us. Additionally, we employed snowball sampling techniques and social media (e.g., Twitter/X36) to identify potential participants.
Data Analysis
For our primary objective, individuals affected by extreme weather conditions (hot/humid or cold/dry) were defined as “responders” using the CAT score MCID36; negative responders had CAT scores ≥ 2 points compared to the ideal/moderate CAT score. Data analysis consisted of descriptive statistics, including means and standard deviations (SD) for continuous variables, median and interquartile range (IQR) for skewed data and counts and percentages for nominal variables. For open-ended questions, text feedback was grouped into overarching themes based on the corresponding weather conditions.
For the secondary objective, repeated-measures ANOVA for interval data (CAT, D-PPAC) and Cochran’s Q test for categorical dependent variables (frequency of exacerbations, rescue inhaler use, healthcare utilization) for each weather condition were performed. Due to the limited sample size, we could not adequately adjust for potential confounders. For significant results for parametric data, Bonferroni corrected pairwise post-hoc analyses were performed. IBM® SPSS Statistics was used, with a p-value < 0.05 considered significant.
Results
Initially, our survey link was publicly shared and received over 400 responses; it raised suspicions of the potential responses from spambots and/or non-eligible individuals seeking the $20 gift card.37 The survey was closed, and each response was reviewed closely. Responses that included characteristics of chronic lung disease (e.g., age, smoking duration, diagnoses, and comorbidities), and/or included sensible open-text comments were included (only n=12). We changed specific questions to filter out bot responses and did not publicly share the survey link before re-releasing the survey. Subsequently, this yielded 25 additional responses to our final dataset of n=37 (online n=31, phone n=5, mail *n=*1). One participant did not complete the survey in its entirety and was excluded.
Participant Characteristics
Out of 36 participants, n=29 (81%) participants reported COPD as their primary diagnosis, with the remainder reporting asthma (11 [31%]), sleep apnea (4 [11%]), interstitial lung disease (2 [6%]), or lung cancer (1 [3%]) as their primary diagnosis. Mean (SD) age was 64.5 (11), and 23 (64%) were female with mean Body Mass Index (BMI) 27.8 (8.4%). Twenty-five (69%) were formerly smoking, and 6 (17%) were currently smoking, with a mean (SD) pack per year of 39.5 (25.6). Participants lived primarily in an urban community [14 (39%)]. Many reported a precipitation level some days of the month (27 [75%]). Mean (SD) of chronic lung disease duration was 12.4 (11.2) years. With respect to PA and dyspnea, 75% (n=27) were minimally active (based on the IPAQ), with a mean (SD) Metabolic equivalent of task (MET) minutes per week of 3688.8 (3306.6) ml/kg/min. Most participants identified themselves as mMRC Grade 1 (13 [36%]) or Grade 2 dyspnea level (12 [33%]).
Tables 1 and 2 provide additional details of daily activity and symptoms, exacerbation-related variables, comorbidities, prognostic indicators, and environmental factors.
Influence of Extreme Weather Conditions
Most responders to the two weather extremes were negative or worse compared to ideal: 23 (66%) in cold/dry and 24 (69%) in hot/humid. Only 9 (25%) were positive responders, and 14 (40%) were non-responders (Table 3).
Mean (SD) CAT score was significantly different between the three weather conditions (p < 0.001), Table 4. Health status in ideal weather conditions (17.2 [7.8]) was significantly higher compared to hot/humid (22.4 [7.4] p< 0.001) and cold/dry conditions (21.4 [8.3], p< 0.001). Both extremes of weather resulted in clinically important decreases in health status (MCID > 4 points).
Mean (SD) D-PPAC total score significantly differed between each weather condition (p< 0.001), Table 4. Post hoc tests revealed a significant increase in overall PA in the hot/humid conditions, 14.7 (3.9) compared to ideal conditions, 13.0 (3.1), p=0.008. There was a decrease in PA in cold/dry conditions 12.2 (4.5) compared to ideal conditions, but it was not statistically significant (p=0.364).
Mean (SD) D-PPAC amount score was significantly worse in both cold/dry (2.2 [1.4]) and hot/humid (2.3 [2.0]), compared to ideal conditions (4.4 [1.4]), p < 0.001. D-PPAC difficulty score was significantly better in both cold/dry at 10.1 (4.6), and hot/humid at 12.4 (4.0) compared to ideal conditions, 8.6 (3.6), p< 0.001.
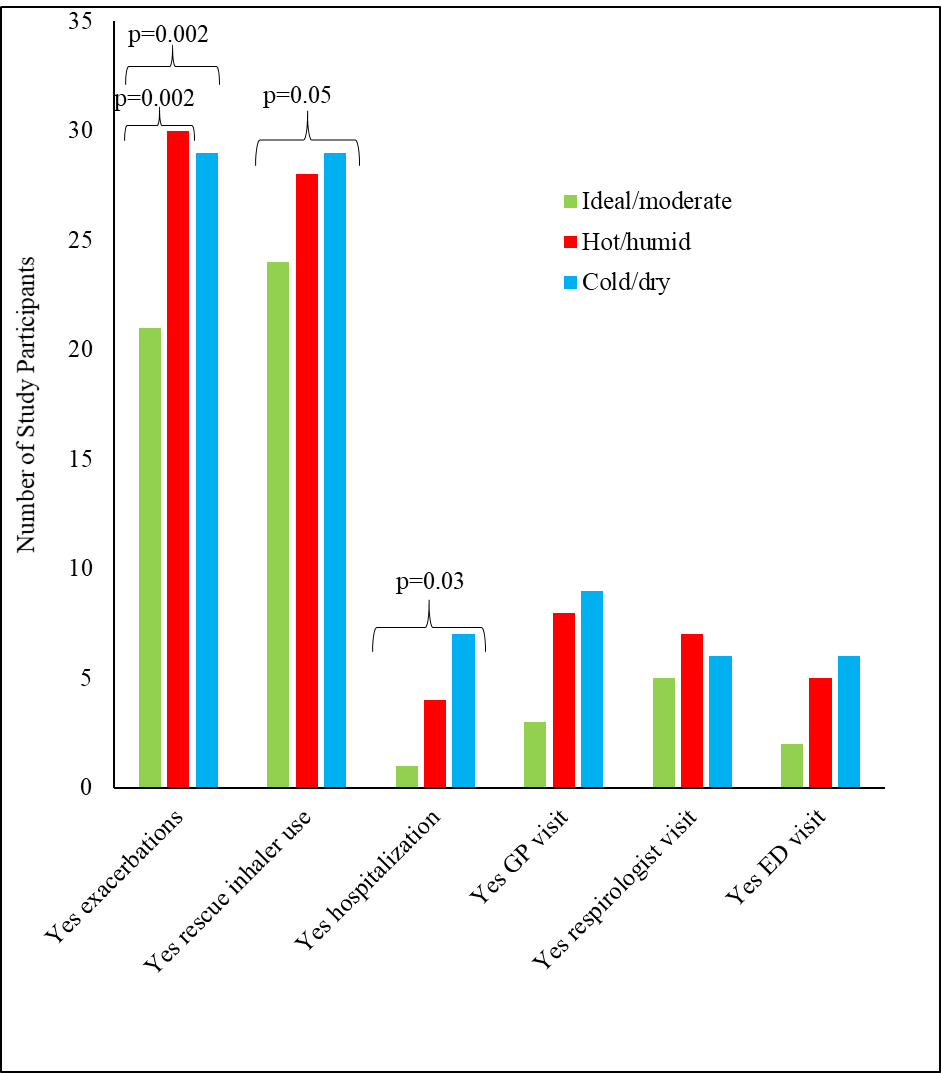
Exacerbations and health utilization were higher in extremes of weather, with the frequency of exacerbations (p=0.002), rescue inhaler use (p=0.05) and hospitalizations (p=0.034) significantly different between each of the three weather conditions, as shown in Figure 1 and Table 4. The only significant pairwise post-hoc result was the number of exacerbations between ideal/moderate and hot/humid conditions, p=0.002. In ideal/moderate conditions, n=15 (42%) did not have an exacerbation, and n=21 (58%) did have an exacerbation. In hot/humid conditions, n=30 (83%) had an exacerbation.

Most participants reported taking no action during ideal conditions, 21 (58%). In cold/dry conditions, 15 (42%) reported avoiding going outside or stayed indoors, 9 (25%) and 7 (19%) limited time outside or used medications. During hot/humid conditions, 27 (75%) avoided going outside or stayed indoors.
Participants’ perceptions and mitigation strategies in different weather conditions
At the end of the survey, some participants (n=12) elaborated on how specific weather conditions affected them. Extreme weather conditions, whether hot or cold, were troublesome for their health, with four participants reporting more problematic effects from hot/humid weather conditions than cold/dry weather. These conditions were perceived as “very big factors in my overall health.” Higher temperatures and humidities were found to make it difficult for participants to "breathe and function." One participant described extreme heat and humidity as causing a “very definite decrease in quality of life.” Another participant described cold weather conditions as “tearing their lungs.” One participant found cold and humid conditions problematic, as “extreme cold and humidity play a very big factor in their overall health.”
Common strategies participants used to prevent the consequences of different weather conditions were avoidance, inhalers, oxygen therapy, and humidification. In ideal temperatures or humid (cold or hot) conditions, participants reported minimal interventions were needed. However, some individuals spent limited time outside despite ideal weather conditions and still needed inhalers and oxygen therapy. In both extreme conditions, participants expressed limited time outside or avoidance. For hot and humid days, many participants conveyed using air conditioning or fans to stay cool. However, some participants noted problems in breathing when air conditioning was set too high (cold). In cold and dry conditions, participants expressed they would also dress warmer. Additionally, participants noted they would use their rescue inhalers before leaving the house for both weather extremes.
Discussion
This study examined the effects of extremes of temperature and humidity on health outcomes in individuals with COPD living in Canada, the majority expressing clinically important decreases in their health status and increased healthcare utilization in both extreme weather conditions. Exacerbation frequency was higher in hot/humid weather. PA score was lower in cold/dry conditions but increased in hot/humid conditions; the amount and difficulty level of PA was reduced in both extreme conditions. There were no significant differences in rescue inhaler use, family doctor and respiratory specialist visits, hospitalizations, or emergency department visits across the three weather conditions.
Cold/Dry vs. Ideal Weather Conditions
In cold/dry weather conditions, we found that participants experienced a lower health status in comparison to ideal conditions. Our findings correlate with those of Miravitlles et al.39, who found worsened health status in the winter compared to the spring and summer seasons. There may be a threshold below which colder temperatures adversely impact respiratory health19,38 as Scheerens et al.39 found in participants with COPD, each 5°C increase in temperature was associated with worsening breathing symptoms and each 5°C decrease in outdoor temperature was associated with worsening cough.
In terms of PA, our study found associations between cold/dry conditions and lower PA, both in the amount and difficulty level. We did not collect data on the types of activities, but we believe during cold/dry conditions, participants decreased their PA and engaged in less vigorous activities. These results align with past studies that reported associations between colder weather and lower PA levels.40,41 Thorpe et al.42 found that some patients would not leave their homes because cold weather made them experience more respiratory symptoms, such as excess coughing, sneezing, and shortness of breath. This is similar to the open-text feedback we received in our survey. With respect to difficulty levels, the literature does support our association of decreased level of activity in colder conditions. Hoaas et al.41 conducted a study in Norway, Denmark and Australia and showed individuals living with COPD walked less and decreased their PA in cooler seasons compared to summer.
The decrease in health status and PA in cold/dry weather may be due to a number of reasons. First, several studies have identified 18°C as a potential threshold of indoor temperature below which adverse health effects may occur.19,38,43,44 These adverse health effects include increased blood pressure and risks of blood clots,43 and increased susceptibility to lung infections and vulnerability to the common cold.23 With respect to PA, colder temperatures may lead to increased bronchoconstriction,45 which has been associated with decreased PA.46
Hot/Humid vs. Ideal Weather Conditions
In hot/humid conditions, there was an association with lower health status and adverse respiratory symptoms. Patients in previous studies reported the summer heat to be an uncontrollable trigger, causing increased morning dyspnea, reduced peak expiratory flow rates and poorer health status.15,47
Participants in our study also reported increased exacerbations during hot/humid conditions. Higher temperatures have been associated with an increase in exacerbations,20 hospitalizations due to exacerbations (5.4% for every 1°C increase),23 and a risk of death due to COPD up to 25%.48,49 Additionally, for individuals with chronic disease, heat waves have been associated with increased morbidity and frequency of hospitalizations.50 In terms of humidity, high relative humidity is associated with worsening of COPD symptoms and increased hospitalizations due to acute exacerbations.51 Jevti et al.52 found for each 10% increase in relative humidity, hospitalizations due to acute exacerbations increased by 0.8%.52
The pathophysiological mechanisms of the association between heat exposure and exacerbation of COPD symptoms leading to hospitalizations are not well understood.24 The heat exposure may induce cytokine release, triggering inflammatory responses causing hyperventilation.53,54 Hyperventilation may lead to acute bronchoconstriction in individuals with pre-existing COPD, exacerbating their dyspnea.55–57 Lin et al.18 speculated that higher temperatures could induce bronchoconstriction58 and elevate concentrations of biological aerosols, which can cause inflammatory and allergic responses in the respiratory tract.59
Our study found hot/humid conditions were associated with higher overall PA, compared to ideal conditions. Although the amount of PA was significantly lower, the overall D-PPAC score was higher due to the decrease in the level of activity difficulty. Prior research conflicts with our results, mainly reporting increases in the amount and difficulty of PA in hot and/or humid weather conditions. Previous studies have found an increase in temperature was associated with a higher amount of PA.21,22 Hoaas et al.41 found individuals with COPD had increased difficulty levels of PA in warmer weather conditions. Although our PA results during higher temperatures contrasted with prior research, they were similar when considering the humidity level. Studies found higher humidities were associated with a decrease in PA.22,60,61 We could not find studies supporting our results of decreased PA difficulty in hot and humid conditions. It is recommended that both the amount and magnitude of PA be measured when investigating the impact of different extremes of weather conditions on individuals with COPD.62
Strengths and Limitations
Strengths
Our study is one of the few that collected information of the effects of temperature and humidity on health outcomes in individuals with COPD living in Canada. Our study used measures (CAT and D-PPAC) that were reliable and valid26,28,31,32,63–65 and defined positive and negative responders27,36,63 to weather extremes. We utilized good recruitment strategies, despite the challenges associated with the COVID-19 pandemic. Our sample had representation from various parts of Canada from different communities of large, medium, and small population sizes. We conducted the survey using multi-modal methods (online/phone/mail) to optimize timeliness and accessibility.66 We collected contextual feedback from participants that would not have been revealed through the close-ended questions, such as other problematic weather conditions and strategies to mitigate negative consequences of weather conditions.
Limitations
Several limitations include the sample size and the generalizability of these results. Our study may have suffered from recall bias and/or under- or over-estimations.67 We included individuals with any illness severity level and diagnoses of other chronic respiratory conditions, possibly influencing the results. However, the overlap of these respiratory disorders is common for individuals with COPD.68,69 The overall survey was not validated; however, as mentioned above, it contained validated instruments. Additionally, the number of questions on the survey may have caused answer fatigue and resulted in more neutral answers. Finally, our survey was anonymous and was affected by bots; results from the first dataset (n=12) and second dataset (n=25) may have differed because we changed specific questions to filter out bot responses before re-releasing the survey. Nevertheless, we were conservative when deciding on legitimate responses, and each item was reviewed closely.
Our study was open to individuals across Canada, and the weather in individual provinces differs. For example, British Columbia experiences cold and humid weather based on participant text feedback, and in our study, we only assessed cold and dry weather conditions. In addition, we likely did not have any French-speaking participants because we did not have the resources to translate the survey. Our sample may not be generalizable to the entire COPD population in Canada due to these limitations; however, this study serves as a pilot study to provide important implications for future research studies.
Future Research
To better understand the impact of weather on individuals with COPD, minimizing the influence of other confounding factors is required. This includes using prospective designs, incorporating individuals with homogenous respiratory disease, and targeting regional weather conditions rather than generalizing for all of Canada. We recommend using objective measurements to identify responders to extreme weather conditions, such as the CAT and D-PPAC, and measuring both PA quantity and magnitude. Studies should consider all spectrums and combinations of temperature and humidity, such as hot and cold temperatures with high and low humidity. The experiences of individuals with COPD in different weather conditions using a qualitative approach should be considered, especially given the varied open-text responses in this study. Other meteorological factors, such as barometric pressure, solar radiation, wind, and even air quality, could also be considered. Finally, future research should involve the development and evaluation of management and coping strategies to help alleviate adverse symptoms and the limitations of individuals with COPD in extreme weather conditions.
Conclusion
This study showed that individuals with COPD living in Canada may be negatively affected by both extremes of hot/humid and cold/dry conditions. This negative response was associated with decreased health status, decreased PA (amount and difficulty level), and increases in exacerbations, rescue inhaler use, and hospitalizations. The development of preventative and management programs is necessary to help individuals with COPD cope with different weather conditions as climate change is a driving factor of increased extreme weather conditions.
Acknowledgments
Thank you to Mr. Ben Bowles and Ms. Pauline Anderson, who have graciously provided feedback and helped develop the proposal and survey. Thank you to the program coordinators who shared the survey, as we were unable to actively recruit participants due to COVID-19.
Contributors
MN, SM, BB, PA (latter two, patient collaborators) conceptualized the study and designed the survey. MN, SM, CB, WS were involved in the data acquisition, data analysis, and interpretation. MN, SM, SQ, CB, WS drafted, reviewed and finalized the manuscript.
Funding
Not applicable.
Competing Interests
No potential competing interest was reported by the authors.
Ethical Declarations
Ethics approval was obtained from the University (REB #: 16029).