
Introduction
Asthma is a chronic inflammatory condition of the airways that poses a significant global public health concern, especially in childhood. It is estimated to affect approximately 262 million individuals worldwide and results in 461,000 deaths annually.1 In Latin America, childhood asthma has a prevalence of 17.3% at 6-7 years of age and 15.8% at 13-14 years of age.2 In Colombia, confirmed asthma has a prevalence of 9%, while unconfirmed cases stand at 69.9%, indicating a potential underdiagnosis within the population. These findings establish asthma as the country’s second most prevalent chronic respiratory condition.3 Furthermore, the city of Cali in Colombia has reported an elevated risk of mortality attributable to respiratory diseases.4
A hallmark of asthma is airway narrowing, which can challenge an individual’s ventilatory mechanics. Bronchial obstruction can result in increased breathing work, changes in lung volumes, imbalances in ventilation/perfusion (V/Q) ratios, and impaired gas exchange.5,6 In addition, these conditions can affect thoracic mobility, which refers to the ability of the thoracic cage to expand during inhalation and exhalation.5,7,8
In contemporary clinical practice, cardiopulmonary physiotherapists emphasize the importance of conducting comprehensive assessments to determine suitable intervention strategies for various respiratory pathologies.9–11 In recent years, cirtometry has emerged as a vital and reliable method for evaluating thoracic mobility.12 This assessment technique is characterized by its simplicity, cost-effectiveness, and consistent reliability across different examiners, within the same examiner, and when repeated.13 It involves the application of a non-distensible tape around the thorax at the axillary (CAx) and xiphoid (CX) levels to obtain non-invasive measurements.14
Given the limited research on thoracic mobility in asthmatic children, this study aimed to describe the thoracic mobility of 6- to 11-year-old children diagnosed with asthma and compare it with that of non-asthmatic children in schools in Cali, Colombia.
Materials and methods
In June 2023, a cross-sectional analytical study was conducted with healthy children and children diagnosed with asthma from two schools in Cali, Colombia. These schools were selected because they are located in socio-demographically representative areas of the city. The parents or guardians of the children were contacted to explain the study’s objectives and request consent for their children’s participation. The study followed the recommendations of the Declaration of Helsinki (2013)15 and was approved by the Ethics Committee of the Institución Universitaria Escuela Nacional del Deporte (Act Number 40.07.101/May 29, 2023). In addition, the confidentiality of the participants was guaranteed through an informed consent procedure in accordance with the Colombian Law on the Protection of Personal Data (Law 1581 of 2012).16 The study included children aged 6 to 11 who attended schools in 2023 and whose parents or guardians voluntarily signed the informed consent form. Participants with respiratory, cardiac, rheumatic, musculoskeletal, and orthopedic diseases and children without signed consent forms were excluded from the study. Non-probability convenience sampling was used to allow voluntary participation in the study.
Measuring instruments and procedures
The study used the self-administered International Study of Asthma and Allergies in Childhood (ISAAC)17 questionnaire to examine sociodemographic variables, prevalence, and risk factors for asthma. This questionnaire was developed in a multi-center study and has been rigorously validated in medical institutions around the world. It encompasses a range of open and closed questions on sociodemographic characteristics such as sex, age, socioeconomic status, and aspects related to wheezing, rhinitis, eczema, treatment modalities, and the child’s medical history.17 Notably, the Spanish version of the questionnaire has demonstrated high specificity (91.6%) and sensitivity (64.7%) in identifying asthma in the general population.18 The questionnaires were distributed online, with parents completing them using the Google Forms® platform.
A non-distensible tape measure (Lufkin W606PM) was used for cirtometry according to the established protocol of Bockenhauer et al.14 Mobility assessment included measurements at two specific levels: CAx at the level of the third intercostal space and the fifth thoracic spinous process, and CX at the level of the xiphoid and the tenth thoracic spinous process. The anatomical reference points of each level were marked with an indelible ink marker by a single examiner with expertise in this area to ensure accurate placement of the tape measure. Measurements were taken with the subject standing, arms relaxed at the sides, and chest uncovered (or with a strapless top for female subjects).
The tape measure was placed comfortably over the marked reference points to ensure the subject’s comfort throughout the process. The subject was then instructed to inhale deeply through the nose and exhale through the mouth, with verbal commands from the examiner to encourage maximal inhalation and exhalation. The maximum diameter of the chest during inhalation and exhalation was measured in centimetres, and the difference between the two movements was calculated. The examiner remained vigilant to prevent compensatory gestures. Three attempts were made ten seconds apart, and the highest measurement was selected.
Anthropometric weight, height, and BMI measurements were obtained to assess potential confounding factors. Weight was assessed using a calibrated scale while the participant maintained an upright posture with arms resting naturally. Height was measured using a SECA 206 wall-mounted measuring rod, with the participant standing against the wall and performing a sustained inhalation for an accurate centimetre measurement. BMI was calculated by dividing weight by the square of height (weight/height2). Participants were then categorized as obese, at risk for obesity, average weight, or underweight based on age-specific percentiles using WHO criteria.
Analysis of results
Data were analyzed using STATA 14® statistical software. Participants with more than 20% data loss from the ISAAC questionnaire were excluded from the analysis. Descriptive statistics were used to present quantitative variables, reporting mean and standard deviation, and qualitative variables, reporting frequency and percentage. The normality of data was assessed using the Kolmogorov-Smirnov test. Group differences were assessed using the Student’s t-test and Wilcoxon-Mann-Whitney test, which were selected based on variable characteristics. Statistical significance was set at p < 0.05. Analysis of covariance was not required because no baseline differences in confounding variables were observed between groups.
Results
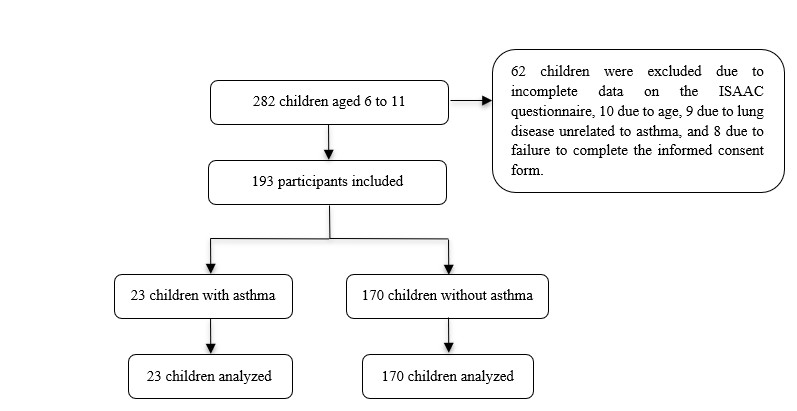
Of the 282 children initially recruited, 62 were excluded because of incomplete data on the ISAAC questionnaire, 10 because of age, 9 because of lung disease other than asthma, and 8 who did not provide informed consent. Finally, 193 children who met the inclusion criteria were included (Figure 1). Among them, 11.9% received a diagnosis of asthma.

The sex distribution was 52.9% male, with the majority in the second (26.9%), third (24.9%), and fifth (25.4%) grades of primary school. Regarding age, 50.3% were between 6 and 8 years old, and 49.7% were between 9 and 11. The majority identified themselves as of mestizo ethnicity (54.9%) and came from lower socioeconomic strata: 1 (55.4%) and 2 (34.7%). In addition, 92.8% reported belonging to the Colombian health system (Table 1).
A statistically significant difference was found in the prevalence of maternal asthma history when comparing children with and without asthma (47.8% for children with asthma vs. 19.4% for the healthy group, p = 0.000). No other statistically significant differences in sociodemographic characteristics were found.
Regarding anthropometric characteristics, the mean height was 1.34 m ± 0.1, the mean weight was 33.9 kg ± 10, and the BMI was at the upper limit of underweight with a mean of 18.4 ± 3.3. No statistically significant differences were found in the variables of height (p = 0.394), weight (p = 0.311), and BMI (p = 0.210) when comparing the groups of children with and without asthma (Table 2).
The data indicate a significantly higher prevalence of asthma symptoms in the asthmatic group compared to the non-asthmatic group during the past year. Specifically, the asthmatic group showed significantly higher rates of wheezing (73.9% vs. 11.2%, p = 0.000), wheezing or whistling before or after exercise (30.4% vs. 2.9%, p = 0.000), chest congestion with secretions in the absence of a cold (30.4% vs. 8.2%, p = 0. 001), rhinitis or nasal allergy (43.5% vs. 24.7%, p = 0.026), hospital admissions for wheeze or asthma (21.7% vs. 2.9%, p = 0.000), and full days of absence from school due to wheeze or asthma (43.5% vs. 2.4%, p = 0.000) compared to the non-asthmatic group (Table 3).
The asthmatic group had a higher prevalence of wheeze triggers compared to the non-asthmatic group for exposure to weather changes (17.4% vs. 5.3%, p = 0.053), fumes (30.4% vs. 2.9%, p = 0.000), dust (47.8% vs. 3.5%, p = 0.000), colds (47.8% vs. 9.4%, p = 0.000), and tobacco smoke (13% vs. 1.8%, p = 0.023) (Table 4).
In assessing thoracic mobility using cirtometry, the asthmatic group exhibited lower values in the CAx measurement, with a mean of 5.18 cm ±1.2, compared to the non-asthmatic group, which demonstrated a mean of 5.82 cm ±2. This disparity showed statistical significance (p = 0.047). Similarly, the CX measurement for the asthmatic group displayed reduced values, with a mean of 4.78 cm ±1.3, in contrast to the non-asthmatic group, with a mean of 5.35 cm ±2. However, this variance did not attain statistical significance (p = 0.096) (Figure 2).

Discussion
This study aimed to describe thoracic mobility in a group of children with obstructive diseases, particularly asthma. The results indicate that children diagnosed with asthma had reduced thoracic mobility compared to those without the condition. In addition, they presented a higher prevalence of pathological history, increased exposure to triggering factors, and a more pronounced experience of daytime and nocturnal respiratory symptoms.
This study demonstrates an association between a parent’s history of asthma and the likelihood that their children will develop the disease. The evidence suggests that there is a “multifactorial inheritance model” that links the occurrence of asthma to the degree of kinship within a family.19 This model can be explained using Falconer’s threshold model,20 which utilizes a standard distribution curve to illustrate how the disease occurs.
According to that model, greater relatedness increases the likelihood of crossing the threshold and displaying the disease. The risk of developing asthma is 10% for second-degree relatives with the disease, 25% for first-degree relatives with the disease, and 50% in cases where both parents are affected.19,21–23 Notably, 19.4% of undiagnosed children had a family history of asthma. Because of their family background, this underscores the potential risk for these children to develop the disease in the future.
In this study, 11.9% of the children reported being diagnosed with asthma. When these results were compared with the global data from the ISAAC study, the prevalence of asthma ranged from 2.1% to 32.2% depending on the geographical area (2.1% in Indonesia, 32.2% in the United Kingdom, and 15% in Latin America).21,24 In Colombia, the prevalence varied by age group, with rates of 24.3% in children younger than 4 years, 12.4% in children aged 5-11, and 11.5% in children aged 12-18.25
The prevalence found in this study is consistent with national levels, although other studies in Cali, Colombia, have reported higher levels. For instance, Herrera et al.26 documented a prevalence of 20.6% in children under 6 years of age, and Betancourt et al.27 reported a prevalence of 21.38% in children aged 6-14 years. This disparity may be due to the higher prevalence of asthma at an early age, possibly related to the increased frequency of respiratory infections during this stage of life.28–31
Regarding wheeze triggers, the study reveals that children diagnosed with asthma show increased symptomatology due to external factors such as weather changes, respiratory infections, inhalation of fumes, exposure to dust, and exposure to tobacco smoke. Early sensitization to house dust mites, especially between the first and second year of life, is associated with significantly increased odds ratios of 3.3 and 6.421 (OR: 1 year, 3.31 [95 % CI 1.59-6.91]; OR: 2 years, 6.37 [95 % CI, 3.48-11.66]).
In addition, exposure to tobacco smoke significantly increases the prevalence of asthma in all age groups. It is a potent pollutant that promotes lung inflammation and mucociliary epithelial damage. This exposure correlates with an incidence rate of up to 17.1% and triggers excessive mucus production in affected children.32,33
In this study, significant triggers were attributed to external factors, while genomic variations contributing to increased susceptibility to the development or severity of asthma symptoms were identified. Genome-wide association studies (GWAS) conducted worldwide have predominantly focused on populations of European ancestry. However, there is a growing consensus that a more comprehensive approach is needed, particularly in regions such as Latin America, to improve understanding of the genetic makeup of these populations.34
Research in Brazil has identified variations in IL-10 genes that correlate with the risk of atopic wheeze and allergy markers. In addition, genes such as 14q11 and 15q22 have shown associations with asthma symptoms in Latin America, while the LTB4 gene has been implicated in inflammatory and immune response pathways.24
The exacerbation triggered by risk factors is postulated to be associated with bronchial hyperresponsiveness (BHR), defined as airway narrowing in response to inhaled agents that induce bronchial smooth muscle contraction. This narrowing is the result of two distinct processes: hypersensitivity and hyperresponsiveness.35,36 The research results on human bronchial segments indicate that an excess of airway smooth muscle contributes to BHR.37 However, there is no consensus on the pathophysiological mechanism of BHR.
Some researchers have proposed that asthmatic patients have increased calcium (Ca2+) levels in the cytoplasm near the actin-myosin filaments, which may account for hyperreactivity. Additionally, an increased frequency of Ca2+ waves released from the sarcoplasmic reticulum due to receptor activation may modify the threshold for agonist-induced contraction, thus explaining the hypersensitivity phenomenon.36
Other researchers suggest that BHR may be influenced by changes in lung volume during the respiratory cycle. Specifically, the radial force applied to the airway during inspiration may trigger mechanisms that suppress tonic cholinergic activity, thereby promoting bronchodilation. In addition, this force could directly impact the smooth bronchial muscle due to the induced stretch.
In conditions such as asthma, the elongation of actin filaments and the more elastic behaviour of smooth muscle may contribute to an increased contractile capacity and shortening velocity, potentially exacerbating symptoms by inducing more profound airway constriction.36
In this study, a reduction in thoracic mobility values was observed in participants within the asthmatic group, possibly due to the airway obstruction associated with BHR, which induces changes in respiratory mechanics.5,38 This finding is noteworthy because previous studies have not prioritized evaluating this aspect of respiratory function in this population.
Previous research has generally relied on complex and costly pulmonary function tests that require specialized equipment and laboratory facilities. These tests have shown that individuals with this condition have a peak expiratory flow (PEF) variability of 20% or greater and a forced expiratory volume (FEV) of less than 80% of the air exhaled in the first second.39
The decreased thoracic mobility observed in children with asthma is related to the obstructive nature of asthma and to BHR, which leads to changes in respiratory mechanics due to several factors, including smooth muscle contraction —referred to as bronchospasm, increased mucus secretion, and thickening of the tracheobronchial wall.5,38 These changes contribute to increased work of breathing, ventilation/perfusion (V/Q) imbalance, impaired gas exchange, and altered lung volumes associated with pulmonary hyperinflation, reducing thoracic mobility.38
It is crucial to highlight the role of the cardiopulmonary physiotherapist in facilitating disease control measures and delivering an appropriate response to symptom exacerbation. To achieve this, it is essential to augment the assessment measures with objective methods, such as cirtometry, which are straightforward, accessible, and cost-effective, particularly in developing countries.
The results of this study indicate that children diagnosed with asthma have reduced thoracic mobility and experience more pronounced respiratory symptoms both during waking hours and at night compared to their non-asthmatic counterparts. It is crucial to recognize that age, developmental stage, and individual anthropometric characteristics may influence these differences in thoracic mobility.40,41 This underscores the need to recognize that underlying pathology and an interplay of variables may influence thoracic mobility.
Further research is required to determine the validity and comparability of cirtometry as an assessment method with high-tech equipment. Also, further research is needed to better understand the efficacy of thoracic mobility measurements in children with asthma. Therefore, the results of this research could significantly impact cardiopulmonary physiotherapy, particularly in relation to managing this condition. It should be noted that the study was population-based, which precludes the possibility of confirming the diagnosis with an airflow limitation test.
Conclusion
Children diagnosed with asthma have reduced thoracic mobility compared to their non-asthmatic counterparts. In addition, a higher percentage of these children have mothers with a history of pulmonary pathology, increased exposure to triggers that exacerbate symptoms, and more pronounced diurnal and nocturnal symptomatology. Cirtometry, a method used to assess thoracic mobility, offers the potential to evaluate and monitor the efficacy of interventions in populations affected by pulmonary pathology, particularly asthma.
Acknowledgments
Thank you to the children and schools for their participation in the study.
Contributors
Conceptualization: T.R.S, G.B.L.D, H.O.N.L, C.M.I.Y, O.T.J.E and R.P.C; Formal analysis: T.R.S, G.B.L.D, H.O.N.L, C.M.I.Y, O.T.J.E and R.P.C; Investigation: T.R.S, G.B.L.D, H.O.N.L, C.M.I.Y, O.T.J.E and R.P.C; Methodology: T.R.S; Project administration: T.R.S, G.B.L.D, H.O.N.L, C.M.I.Y and R.P.C; Resources:T.R.S; Supervision: T.R.S; Visualization: T.R.S, G.B.L.D, H.O.N.L; Writing – original draft: T.R.S,G.B.L.D, H.O.N.L; Writing – review & editing: T.R.S, G.B.L.D, H.O.N.L.
Funding
This study did not receive any specific grant from funding agencies in the public, commercial, or not-for-profit sectors.
Competing interests
All authors have completed the ICMJE uniform disclosure form and declare no conflict of interest.
Ethical approval
The study was approved by the Ethics Committee of the Institución Universitaria Escuela Nacional del Deporte (Act Number 40.07.101/May 29, 2023).
AI Statement
The authors confirm no generative AI or AI-assisted technology was used to generate content.